RRG - Restoration Dashboard


Business challenge
The Restoration Dashboard had a lot of information that needed to be digestable to the people using it.The information needed to be shown on a high-level (Bird’s eye view) and the user should be able to access the details of individual records at a glance as well.
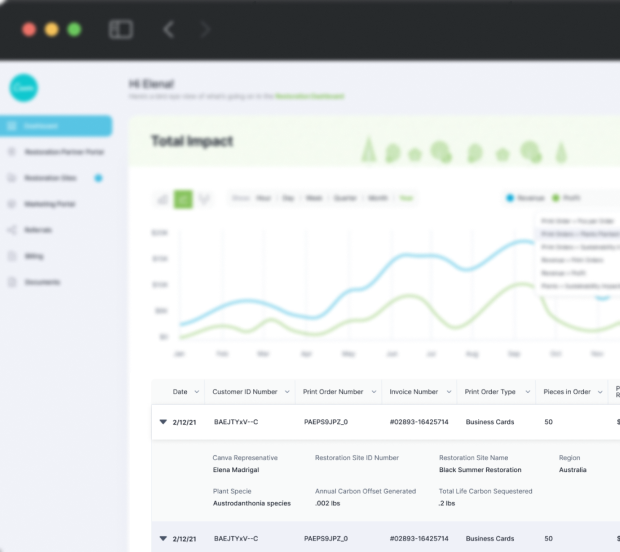
Restored Dashboard
Diverse stakeholders have a different perspective on how to view and analyze information, we needed to cater to all of them without cluttering the interface.
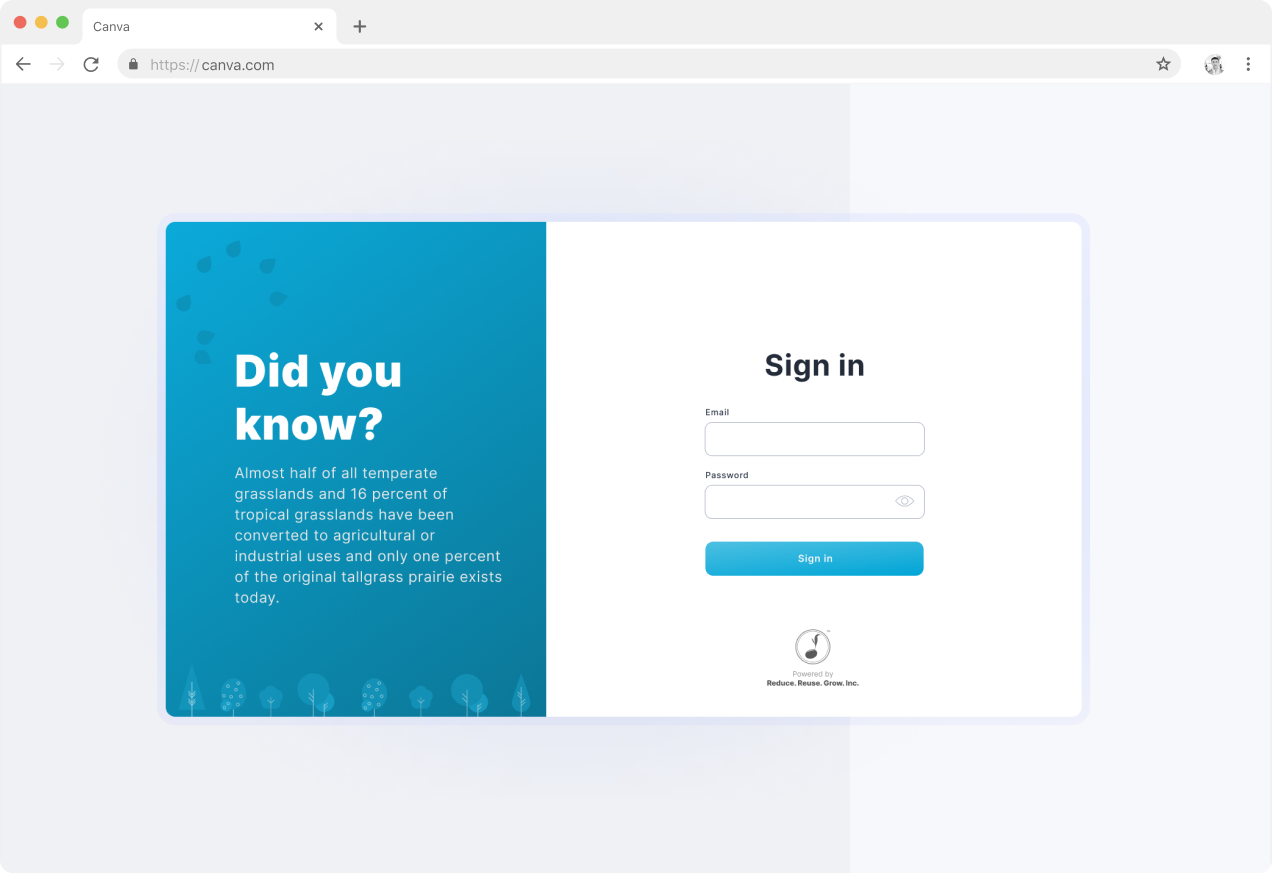
Sign up
The sign-in screen shows facts about climate change and how our processes
are degrading the environment.
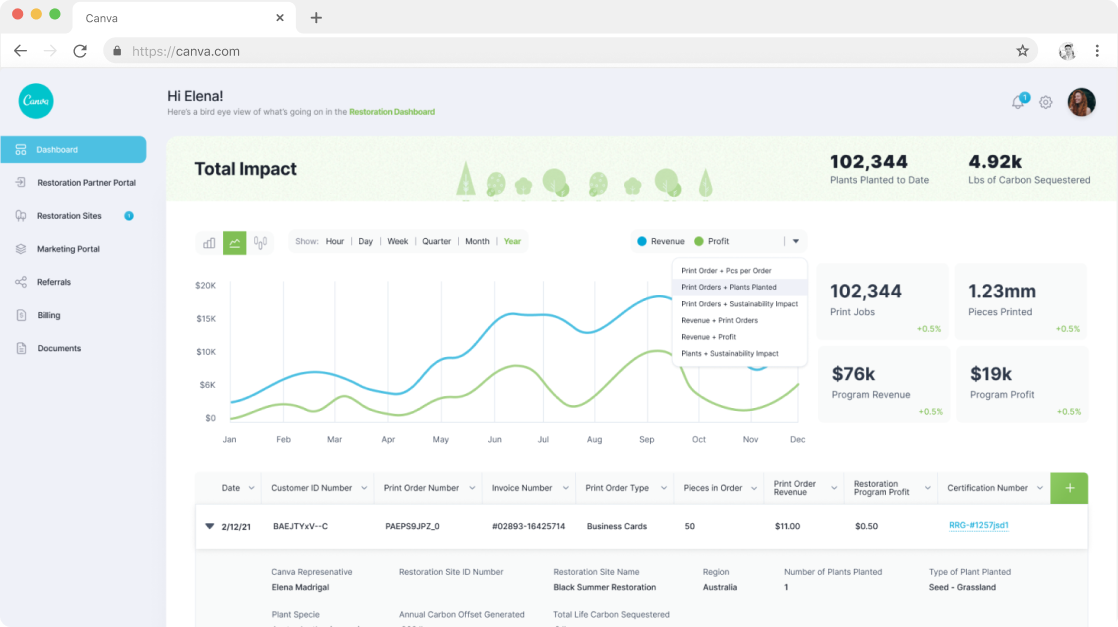
Dashboard
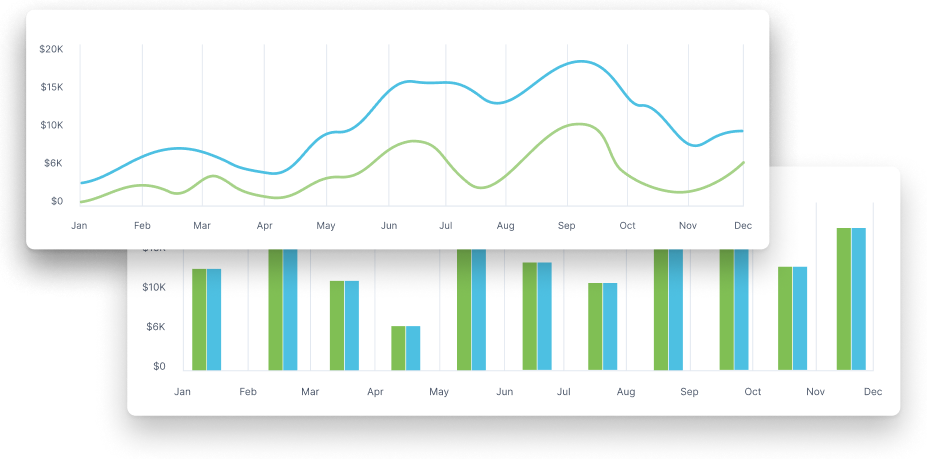
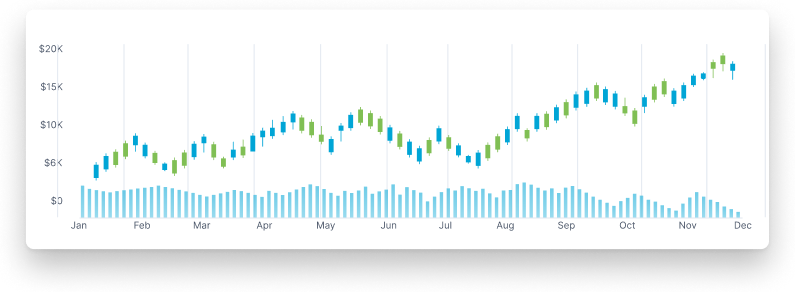
Variables within the data visualization chart can be changed to view information
that is relevant to a stakeholder group

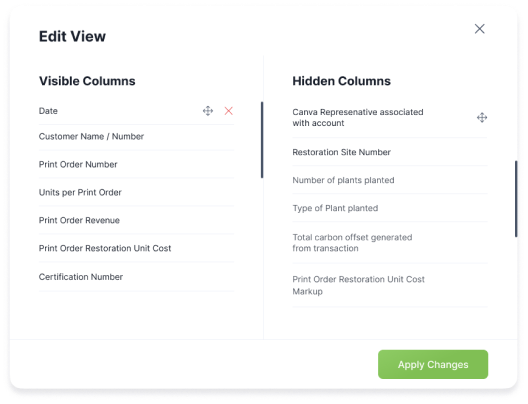
Expandable rows
Rows in the tabke are expandable to show secondry information that is not readily required but can easily be accessed when needed
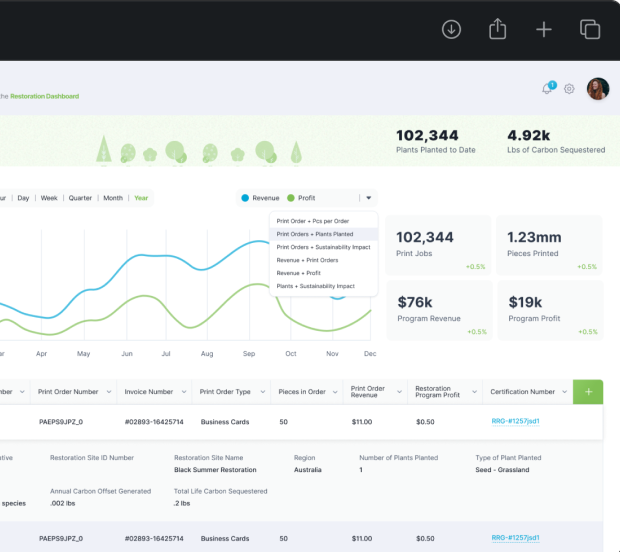
Visualization chart
Variables within the data visualization chart can be changed to view information that is relevant to a stakeholder group.
Row information
Customizable row categories. Whatever is important to view for a particular group of users can be set with the rest of the information visible when the row is expanded
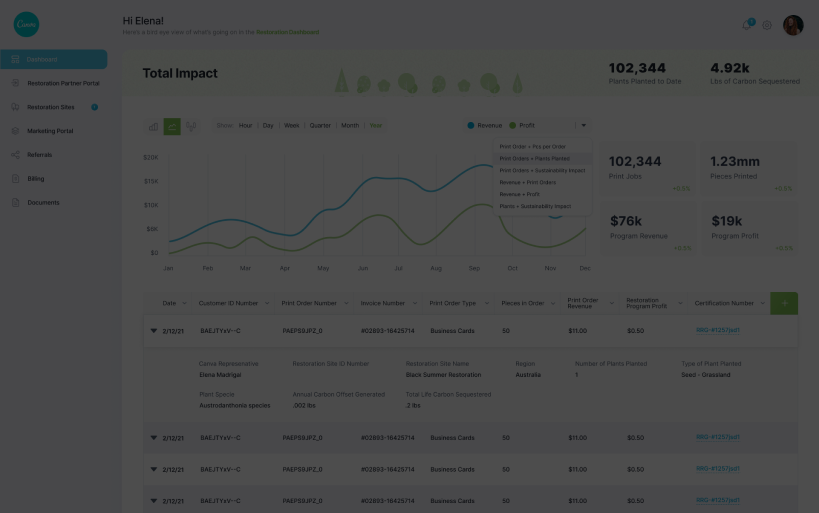
Data visualization
Variables within the data visualization chart can be changed to view information that is relevant to a stakeholder group.
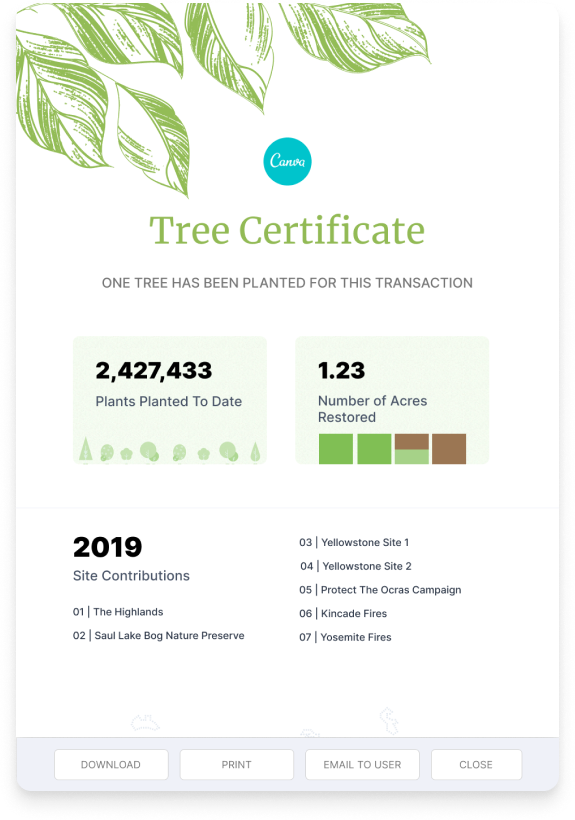
Delight the audience
To give users a sense of accomplishment , a certificate of acknowledgement is given that can be downloaded